Skip to content

Deutsche Bahn

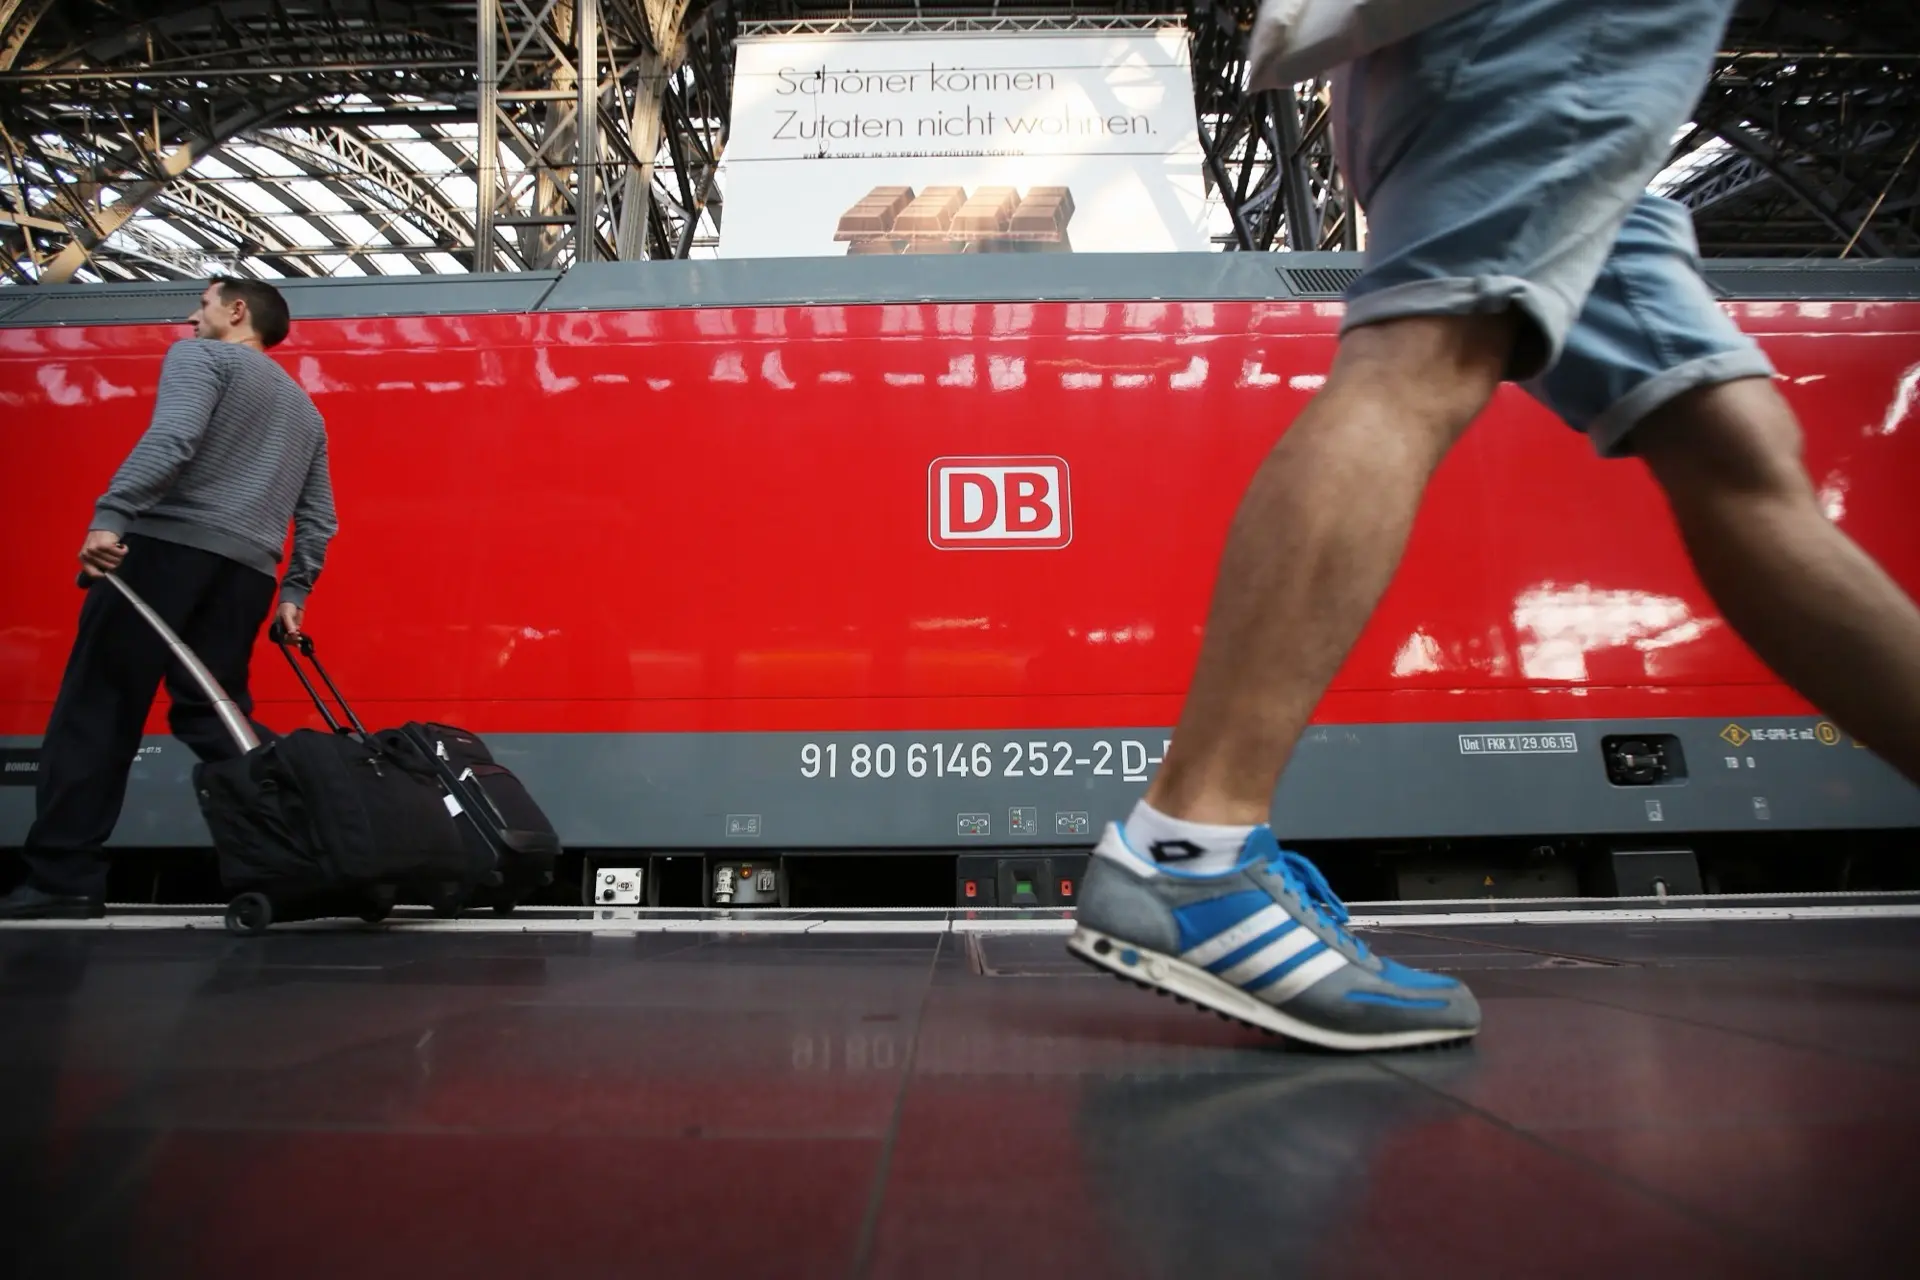
A red Deutsche Bahn locomotive at a station platform, a traveller with a wheeled case beside it and a passer-by striding past in the foreground

About:

An operations team at Deutsche Bahn was assembling its weekly reports by hand from several systems. We built the data pipeline that joins them and the dashboards the team now works from.

Year

2024

Client

Deutsche Bahn

Services

Data Pipelines

BI Dashboards

Systems Integration

Reporting Automation

Industry

Rail & Mobility

A white concrete facade of deep, repeating window bays under a cloudy sky
A cantilevered concrete corner with dark windows against a pale blue sky

Goals of the Project:

Replace a weekly manual reporting cycle with figures that refresh on their own, and that every team reads the same way.

Connect the source systems, agree one definition for each metric, and put the result in front of the people who use it.

A laptop mockup balanced on a white rock
The front and back of a business card mockup on grey
A tablet and a phone mockup with a stylus on a wooden desk

Outcome:

Reporting that took five working days now refreshes every morning, and manual data handling fell by 70%.

Teams work from one dashboard instead of a stack of spreadsheets, and every figure traces back to its source.